2019 Study of Undergraduate Students and Information Technology

3 students looking at a laptop

This study presents important findings from EDUCAUSE's 2019 research on students and information technology. It also provides technology and higher education leaders with recommendations for addressing students' most pressing technology support and solution needs, with the goal of enriching students' learning experiences on campus and helping to advance student success.

Read full report: PDF | HTML | Other materials

Key Findings

Drawing on survey data from more than 40,000 students across 118 US institutions, this report highlights a number of important findings related to students' technology preferences, supports, and experiences, with the goal of aiding technology and higher education professionals in improving student learning experiences and success.

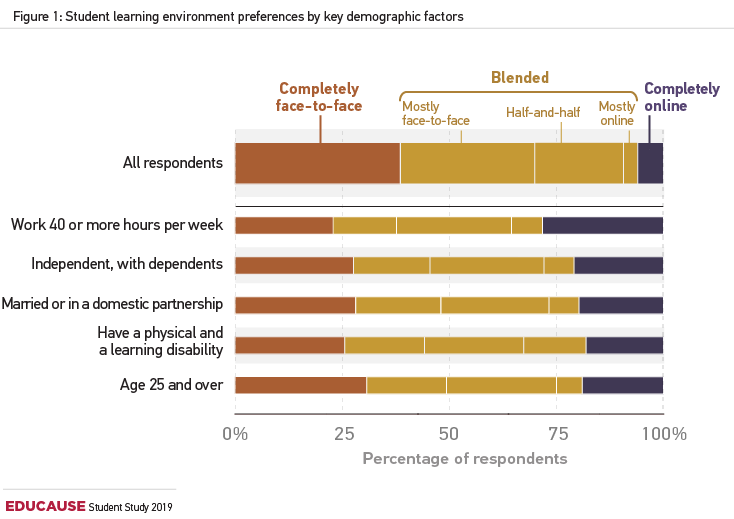
Learning Environment Preferences

While the majority of students (70%) prefer mostly or completely face-to-face learning environments, specific demographic factors influence these preferences. Read more about learning environment preferences >

Bar graph showing student learning environment preferences, by key student demographic factors. Y-axis shows category of respondents. X-axis shows
percentage of respondents.
All data given is approximate.
All respondents: Completely face-to-face = 38%; Mostly face-to-face = 50%; Half-and-half = 40%; Mostly online = 10%; Blended (total of Mostly face-to-face, half-and-half, and Mostly online) = 52%; Completely online = 10%
Work 40 or more hours per week: Completely face-to-face = 24%; Mostly face-to-face = 25%; Half-and-half = 65%; Mostly online = 10%; Blended (total of Mostly face-to-face, half-and-half, and Mostly online) = 44%; Completely online = 32%
Independent, with dependents: Completely face-to-face = 27%; Mostly face-to-face = 30%; Half-and-half = 60%; Mostly online = 10%; Blended (total of Mostly face-to-face, half-and-half, and Mostly online) = 53%; Completely online = 20%
Married or in a domestic partnership: Completely face-to-face = 28%; Mostly face-to-face = 31%; Half-and-half = 61%; Mostly online = 8%; Blended (total of Mostly face-to-face, half-and-half, and Mostly online) = 54%; Completely online = 18%
Have a physical and a learning disability: Completely face-to-face = 26%; Mostly face-to-face = 17%; Half-and-half = 20%; Mostly online = 18%; Blended (total of Mostly face-to-face, half-and-half, and Mostly online) = 55%; Completely online = 19%
Age 25 and over: Completely face-to-face = 32%; Mostly face-to-face = 15%; Half-and-half = 27%; Mostly online = 5%; Blended (total of Mostly face-to-face, half-and-half, and Mostly online) = 47%; Completely online = 21%


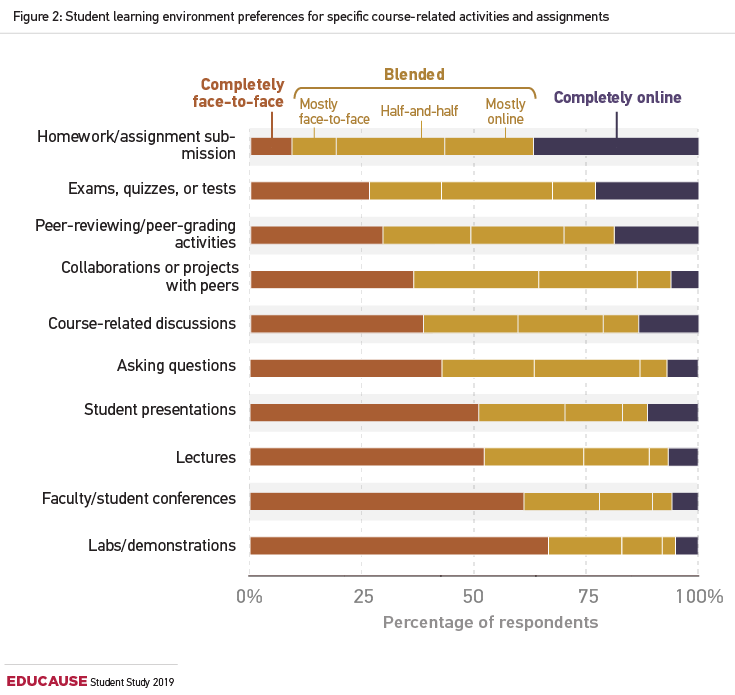
Face-to-Face Activities

Labs and demonstrations, faculty/student conferences, and lectures were rated as the most preferred activities in completely face-to-face environments. Read more about face-to-face activities>

Bar graph showing student learning environment preferences for specific course-related activities and assignments. Y-axis shows category of activities and assignments. X-axis shows percentage of respondents.
All data given is approximate.
Homework/assignment submission: Completely face-to-face = 10%; Mostly face-to-face = 10%; Half-and-half = 25%; Mostly online = 20%; Blended (total of Mostly face-to-face, half-and-half, and Mostly online) = 55%; Completely online = 35%
Exams, quizzes, or tests: Completely face-to-face = 27%; Mostly face-to-face = 15%; Half-and-half = 25%; Mostly online = 10%; Blended (total of Mostly face-to-face, half-and-half, and Mostly online) = 50%; Completely online = 23%
Peer reviewing/peer-grading activities: Completely face-to-face = 30%; Mostly face-to-face = 20%; Half-and-half = 10%; Mostly online = 10%; Blended (total of Mostly face-to-face, half-and-half, and Mostly online) = 50%; Completely online = 20%
Collaborations or projects with peers: Completely face-to-face = 35%; Mostly face-to-face = 27%; Half-and-half = 23%; Mostly online = 10%; Blended (total of Mostly face-to-face, half-and-half, and Mostly online) = 60%; Completely online = 5%
Course-related discussions: Completely face-to-face = 35%; Mostly face-to-face = 20%; Half-and-half = 20%; Mostly online = 10%; Blended (total of Mostly face-to-face, half-and-half, and Mostly online) = 50%; Completely online = 15%
Asking questions: Completely face-to-face = 37%; Mostly face-to-face = 20%; Half-and-half = 25%; Mostly online = 10%; Blended (total of Mostly face-to-face, half-and-half, and Mostly online) = 55%; Completely online = 8%
Student presentations: Completely face-to-face = 52%; Mostly face-to-face = 20%; Half-and-half = 13%; Mostly online = 5%; Blended (total of Mostly face-to-face, half-and-half, and Mostly online) = 38%; Completely online = 10%
Lectures: Completely face-to-face = 53%; Mostly face-to-face = 20%; Half-and-half = 15%; Mostly online = 5%; Blended (total of Mostly face-to-face, half-and-half, and Mostly online) = 40%; Completely online = 7%
Faculty/student conferences: Completely face-to-face = 60%; Mostly face-to-face = 18%; Half-and-half = 13%; Mostly online = 5%; Blended (total of Mostly face-to-face, half-and-half, and Mostly online) = 35%; Completely online = 5%
Labs/demonstrations: Completely face-to-face = 65%; Mostly face-to-face = 20%; Half-and-half = 10%; Mostly online = 2%; Blended (total of Mostly face-to-face, half-and-half, and Mostly online) = 32%; Completely online = 3%


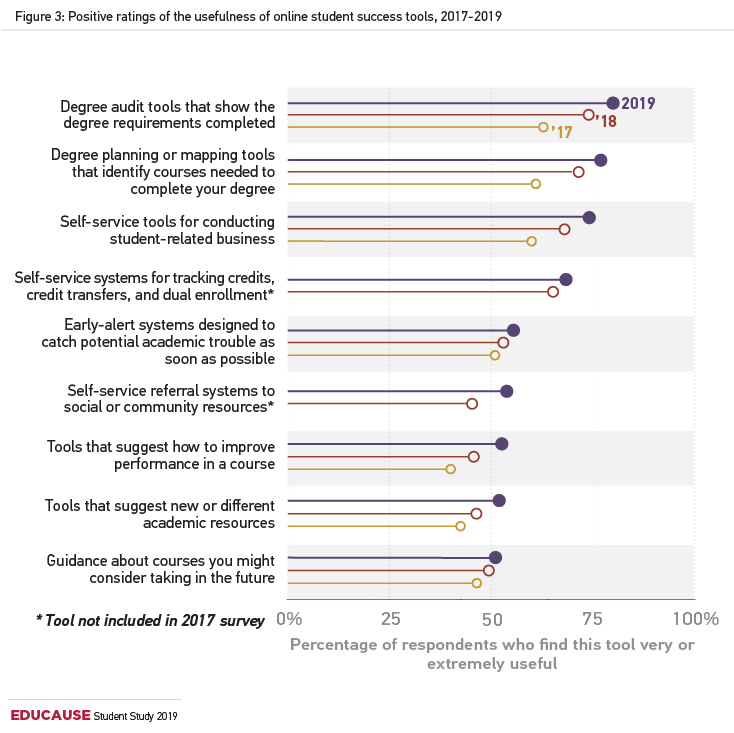
Student Success Tools

For the students who use them, online success tools have become increasingly useful in navigating their college experience. Read more about student success tools >

Bar graph showing the increase in the perceived usefulness of online student success tools from 2017 to 2019.
Y-axis shows the tools. X-axis shows the percentage of respondents who find this tool very or extremely useful from 0% to 100%.
All data given is approximate.
Degree audit tools that show the degree requirements completed: 2017 = 62%; 2018 = 75%; 2019 = 80%.
Degree planning or mapping tools that identify courses needed to complete your degree: 2017 = 60%; 2018 = 73%; 2019 = 78%.
Self-service tools for conducting student-related business: 2017 = 60%; 2018 = 70%; 2019 = 75%.
Self-service systems for tracking credits, credit transfers, and dual enrollment: 2017 = not included in survey; 2018 = 60; 2019 = 70%
Early-alert systems designed to catch potential academic trouble as soon as possible: 2017 = 51%; 2018 = 53%; 2019 = 55%.
Self-service referral systems to social or community resources: 2017 = not included in survey; 2018 = 45%; 2019 = 55%
Tools that suggest how to improve performance in a course: 2017 = 30%; 2018 = 45%; 2019 = 55%.
Tools that suggest new or different academic resources: 2017 = 35%; 2018 = 40%; 2019 = 55%.
Guidance about courses you might consider taking in the future: 2017 = 45%; 2018 = 50%; 2019 = 53%.


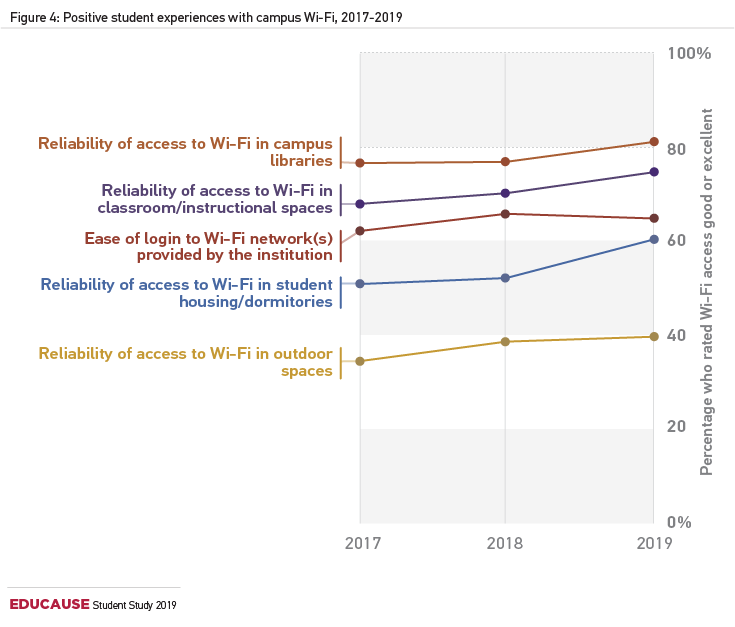
Technology Experiences

Dormitories/campus housing and outdoor spaces continue to be rated at the bottom when it comes to reliable Wi-Fi. Read more about experiences with W-Fi >

Line graph showing positive student experiences with campus Wi-Fi, 2017 to 2019.
Left Y-axis shows the categories. Right Y-axis shows the percentage who rated Wi-Fi access good or excellent from 0% to 100%. X-axis shows the year 2017 to 2019.
All data given is approximate.
Reliability of access to Wi-Fi in campus libraries = Increase from 78% in 2017 to 81% by 2019.
Reliability of access to Wi-Fi in classroom/instructional spaces = Increase from 70% in 2017 to 75% by 2019.
Ease of login to Wi-Fi network(s) provided by the institution = Increase from 62% in 2017 to 65% in 2018 and then down to 64% by 2019.
Reliability of access to Wi-Fi in student housing/dormitories = Increase from 50% in 2017 to 60% by 2019.
Reliability of access to Wi-Fi in outdoor spaces = Increase from 35% in 2017 to 40% by 2019.


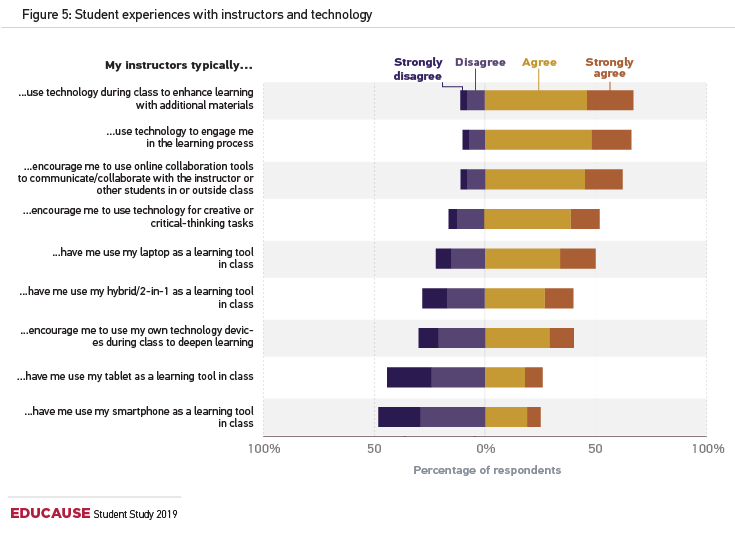
Technology Use in the Classroom

Two-thirds of students agreed that their instructors use technology to engage them in class, but it is not always with the devices students already own. Read more about technology use in the classroom >
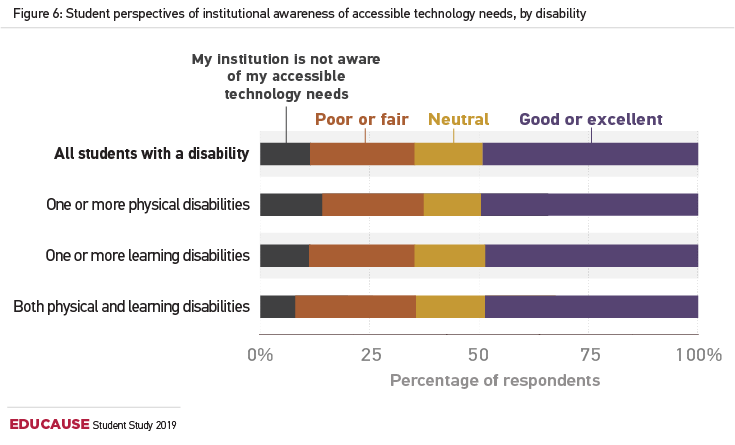
Stacked bar graph showing the student experience with instructors and technology.
X-axis represents the percentage of respondents from 100% to 0% (disagree) and 0% to 100% (agree).
Y-axis represents the completion of the sentence “My instructors typically…”
All data given is approximate.
…use technology during class to enhance learning with additional materials: Strongly disagree = 5%; Disagree = 10%; Agree = 48%; Strongly agree = 25%.
…encourage me to use online collaboration tools to communicate/collaborate with the instructor or other students in or outside class: Strongly disagree = 5%; Disagree = 10%; Agree = 48%; Strongly agree = 15%.
…use technology to engage me in the learning process: Strongly disagree = 3%; Disagree = 8%; Agree = 48%; Strongly agree = 15%.
…encourage me to use technology for creative or critical-thinking tasks: Strongly disagree = 7%; Disagree = 20%; Agree = 40%; Strongly agree = 15%.
…have me use my laptop as a learning tool in class: Strongly disagree = 10%; Disagree = 20%; Agree = 35%; Strongly agree = 15%.
…encourage me to use my own technology devices during class to deepen learning: Strongly disagree = 10%; Disagree = 20%; Agree = 30%; Strongly agree = 10%.
…have me use my hybrid/2-in-1 as a learning tool in class: Strongly disagree = 20%; Disagree = 25%; Agree = 28%; Strongly agree = 12%.
…have me use my tablet as a learning tool in class: Strongly disagree = 20%; Disagree = 30%; Agree = 20%; Strongly agree = 5%.
…have me use my smartphone as a learning tool in class: Strongly disagree = 18%; Disagree = 30%; Agree = 20%; Strongly agree = 5%.


Accessibility

Only half of the students who have physical and/or learning disabilities and who need accessible technologies or accommodations rated their institution’s support positively. Read more about accessibility >
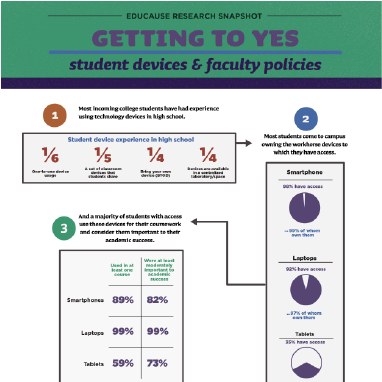
Stacked bar graph showing student perspectives of institutional awareness of accessible technology needs, by disability.
X-axis represents the percentage of respondents from 0% to 100%.
Y-axis represents the categories of disabilities.
All data given is approximate.
All students with a disability: My institution is not aware of my accessible technology needs = 10%; Poor or fair = 25%; Neutral = 15%; Good or excellent = 50%
One or more physical disabilities: My institution is not aware of my accessible technology needs = 15%; Poor or fair = 25%; Neutral = 10%; Good or excellent = 50%
One or more learning disabilities: My institution is not aware of my accessible technology needs = 10%; Poor or fair = 25%; Neutral = 15%; Good or excellent = 50%
Both physical and learning disabilities: My institution is not aware of my accessible technology needs = 5%; Poor or fair = 30%; Neutral = 15%; Good or excellent = 50%


Infographic

Download the 2019 student and faculty infographic now.


Get Involved and Get Data

laptop with graphs on the screen

Sign up for the 2020 student survey—there's no fee and you gain access to data for your institution and peers. 2019 survey participants can access data now in the ETRAC Portal.


Related Resources