2020 Student Technology Report: Supporting the Whole Student

2020 Student Technology Report

This study presents important results from EDUCAUSE's 2020 research on students’ experience with information technology, which included 16,162 undergraduate students from 71 US institutions.

The study includes key findings from our analysis of students’ responses, concrete next steps your institution can take in response to those findings, and opportunities for connecting with peers who are implementing innovative practices in the areas of student success, technology use and environmental preferences, data privacy, online harassment, and accessibility.

Read full report: HTML | Other materials


Student Success

The majority of students who received early alerts and nudges found them to be very or extremely useful, and nearly all (92%) thought they were at least moderately so.

Read more about student success >

TItle: Figure 6: Student ratings of academic alert and nudge usefulness. Stacked bar showing the student ratings of the usefulness of alerts (among the students who received an alert).  Not at all useful + Not very useful	8%. Moderately useful 37%. Very useful + Extremely useful 55%.


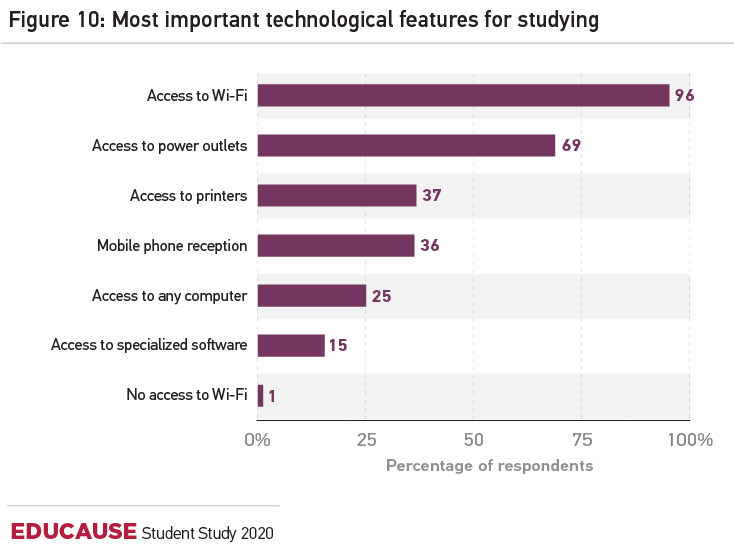
Technology Use and Environmental Preferences

No technology is more important to students when studying than Wi-Fi. Access to power outlets comes in a distant second place as a technology need for students. Actual devices—printers, phones, computers—are significantly less important for students when getting down to the business of studying.

Read more about technology use and environmental preferences >
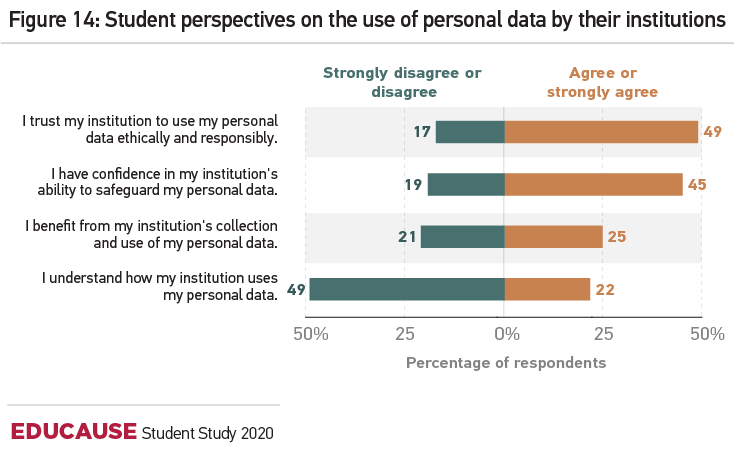
Title: Figure 10: Most important technological features for studying. Bar graph showing the technological features most important for studying among student respondents.  Access to Wi-Fi 	96%.  Access to power outlets 	69%.  Access to printers 	37%.  Mobile phone reception 	36%.  Access to any computer 	25%.  Access to specialized software 	15%.  No access to Wi-Fi 	1%.


Data Privacy

Students' lack of understanding about how their institution uses personal data undermines both their trust in that use and their confidence in how their institution protects personal data.

Read more about data privacy >
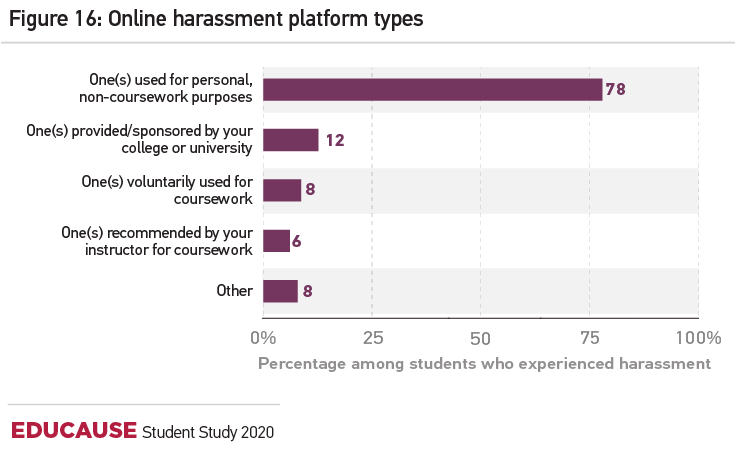
Title: Figure 14: Student perspectives on the use of personal data by their institutions. Percentage of students who Strongly (D)isagree or disagree vs (A)gree or strongly agree with each statement. I trust my institution to use my personal data ethically and responsibly.	D 17%	A 49%.  I have confidence in my institution's ability to safeguard my personal data.	D 19%	A 45%.  I benefit from my institution's  collection and use of my personal data.	D 21%	A 25%.  I understand how my institution uses my personal data.	D 49%	A 22%.


Online Harassment

Although most of the online harassment that all respondents told us they experienced occurs in environments used for personal, non-coursework purposes, more Black/African American, Hispanic/Latinx, and Asian/Pacific Islander students said they are harassed in environments or apps their institution provides or sponsors than white students.

Read more about online harassment >

TItle: Figure 16: Online harassment platform types.  Among students who experienced harassment, the percentage who experienced it on each type of platform.  One(s) used for personal, non-coursework purposes 	78%.  One(s) provided/sponsored by your college or university 	12%.  One(s) voluntarily used for coursework 	8%.  One(s) recommended by your instructor for coursework 	6%.  Other	8%.


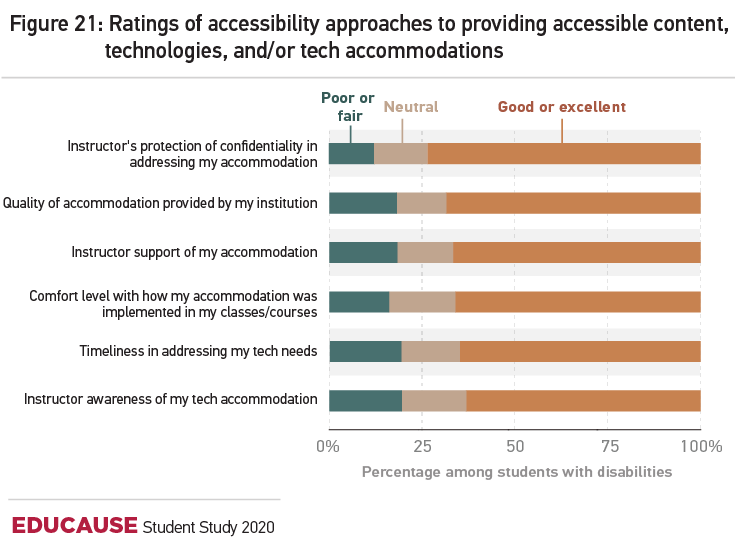
Accessibility and Accommodations

Many students with disabilities did not have positive responses to how their institution supported their need for accessible content and/or technology accommodations.

Read more about accessibility and accommodations >

Title: Figure 21: Ratings of accessibility approaches to providing accessible content, technologies and/or tech accomodations. Among students with disabilities, ratings of accessibility approaches to providing accessible content, technologies, and/or tech accommodations. (P)oor or fair, (N)eutral, (G)ood or excellent. Instructor's protection of confidentiality in addressing my accommodation	P 12%,	N 15%,	G 73%.  Quality of accommodation provided by my institution	P 18%,	N 14%,	69%.  Instructor support of my accommodation	P 18%,	N 15%,	G 67%.  Comfort level with how my accommodation was implemented in my classes/courses	P 16%	N 18%	G 66%.  Timeliness in addressing my tech needs	P 19%,	N 16%,	G 65%.  Instructor awareness of my tech accommodation	P 19%,	N 17%,	G 63%.


Get Involved and Get Data

Sign up for the Fall 2020 student survey—there's no fee and you gain access to data for your institution and peers.