2022 Students and Technology Report: Rebalancing the Student Experience

2022 Students and Technology Report: Rebalancing the Student Experience


Read full report: HTML | Other materials


In our latest student technology report we share the results of our spring 2022 survey of 820 U.S. undergraduate students, across four key areas: Technology Challenges and Solutions, Modality Preferences, Access to Educational Technology, and Student Success.

Learn about what students told us they need and want, and get recommendations on how to translate the research into action at your institution.

Read the report introduction >


Technology Challenges and Solutions

Stacked bar charts for seven technology issues. For each issue, data show the percentage of respondents who have experienced it without stress, experienced it with stress, or have not experienced it. Topping the list is unstable internet connections, with about a third of respondents experiencing it with stress and another third experiencing it without stress. Other issues are device malfunctioning when needed, inability to run required apps or software, not having needed apps or software, improperly configured devices, lack of access to primary device when needed, and device breaking when needed. Each issue was experienced with stress by at least 12% of respondents.

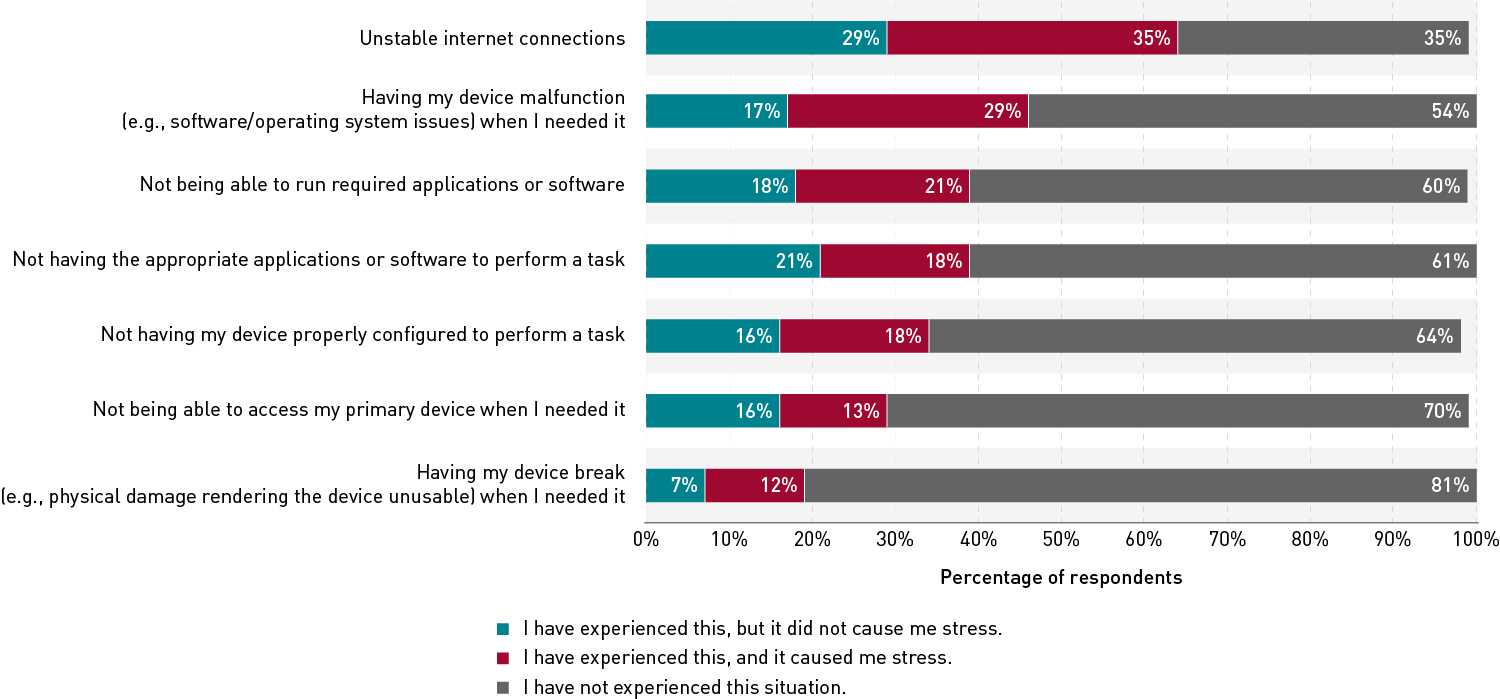
While educational technology can certainly enhance students' experiences, it can present some challenges as well. More than three-quarters (77%) of respondents reported having experienced one or more technology issues within the past academic year.

Read more about technology challenges and solutions > 


Modality Preferences

Double bar chart comparing respondents' modality preferences in 2020 (before March 11) and 2022. Preferences for completely or mostly face-to-face decreased. Preferences for completely or mostly online increased. For example, in 2020 only 5% of respondents said they preferred completely online courses, but in 2022 20% of respondents said they preferred completely online courses.

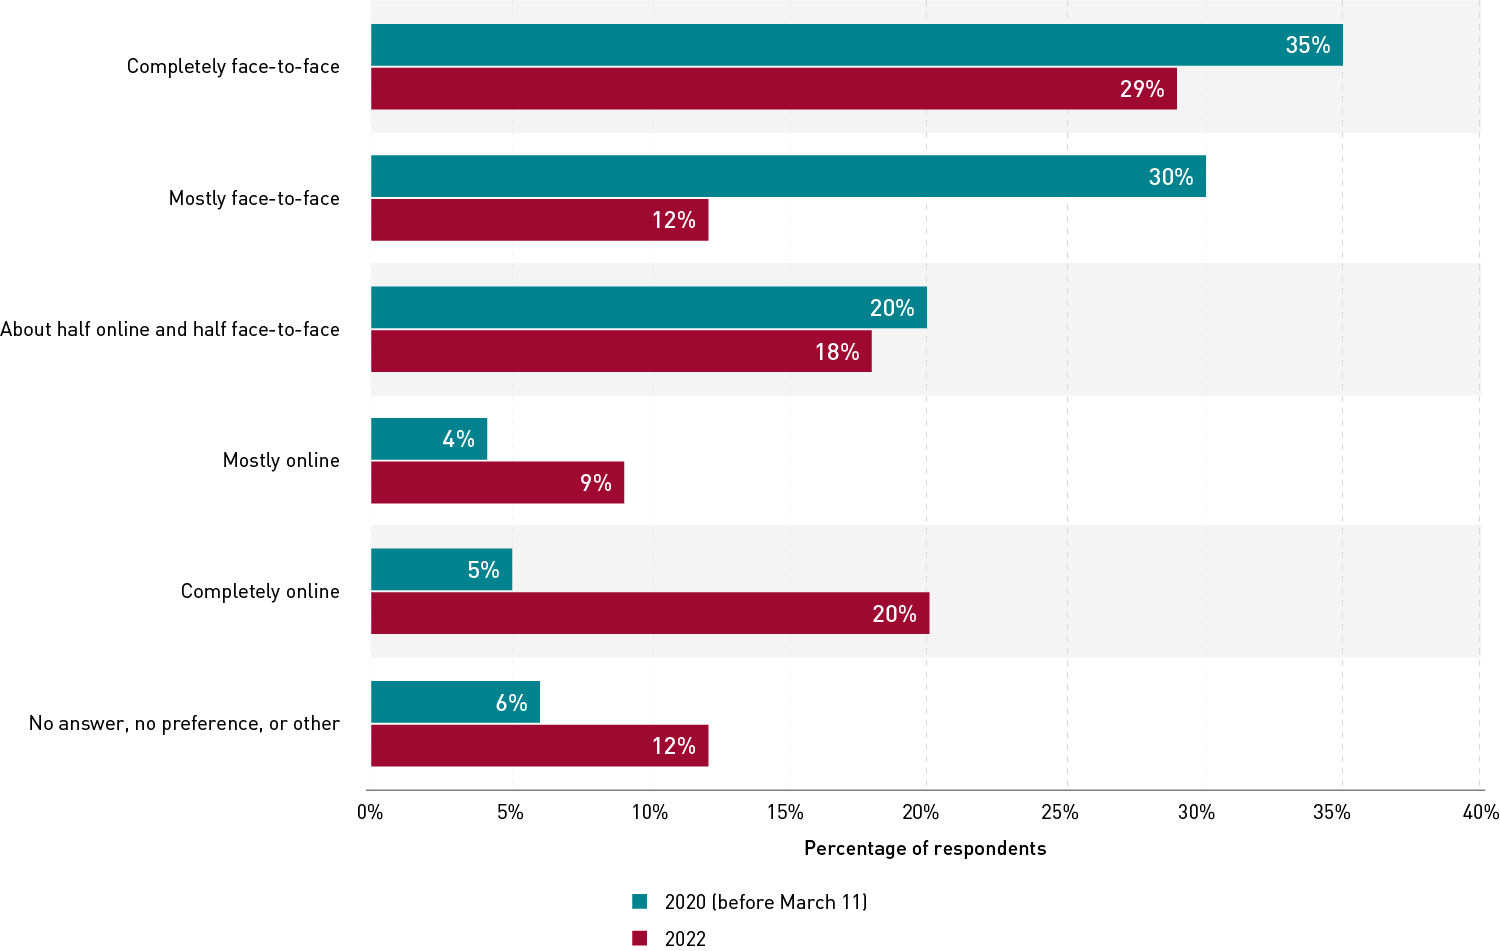
One of the hottest topics in higher education these days is the future of instructional modalities. Survey data reveal an interesting trend in students' stated preferences.

Learn more about modality preferences >


Access to Educational Technology

Stacked bar chart of respondents' needs for specific assistive technologies. The bars include the responses 'I need it and have access to it' and 'I need it but don't have access to it.' Each technology was selected by at least 18% of students as necessary, with 5% to 10% of respondents indicating that they did not have access to it. In descending order, the technologies are closed captions on videos, digital player or recorder, word prediction software, digital highlighter, text-to-speech software, speech-to-text software, pentop computer, digital magnifier, and screen reader.

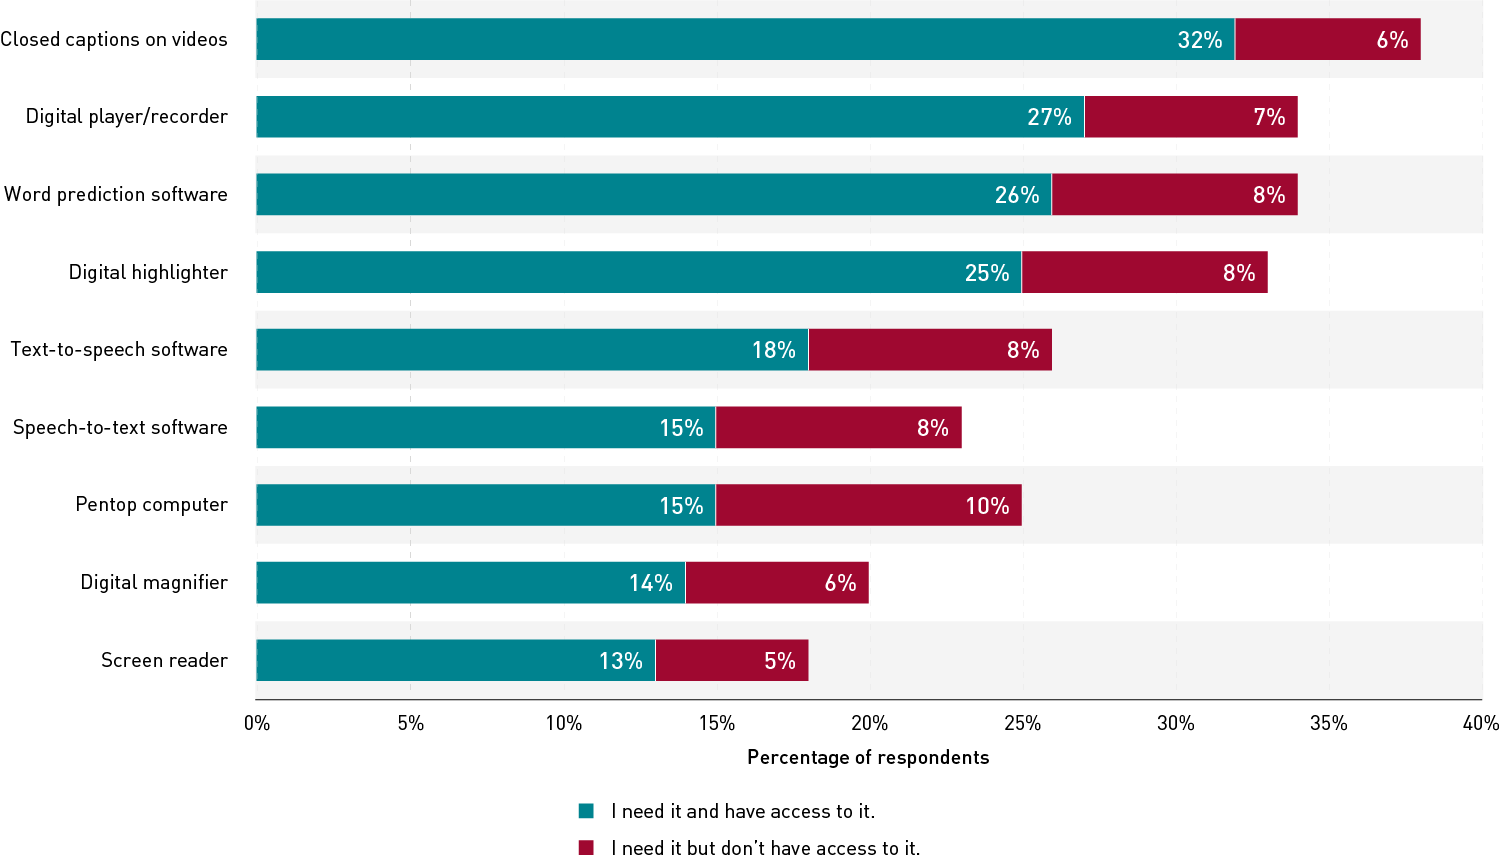
Assistive technology is not only for students with disabilities. In this survey, only 5% of respondents indicated that they have a disability for which they need assistive technology. However, when provided with a list of specific assistive technologies, every item on the list was selected as necessary by at least 18% of respondents.

Read more about access to educational technology >


Student Success

Bar chart of respondents' most important success measures for their undergraduate experiences. The most selected measure is completing a degree, selected by 30% of respondents. Each of the other measures was selected by 3% to 15% of respondents. In descending order they are securing a job, achieving personal growth, securing a high salary, achieving a high GPA, gaining specific skills, gaining general knowledge, securing promotion or career advancement, and gaining independence.

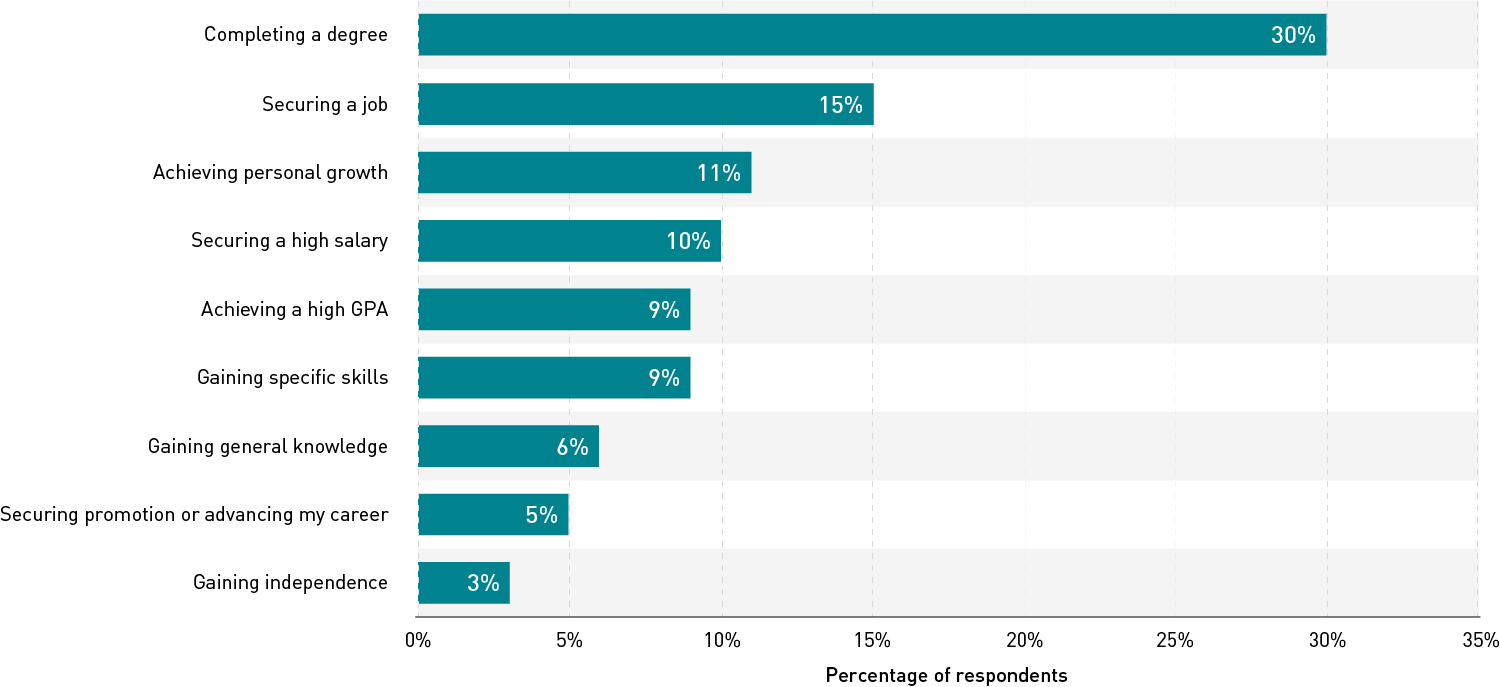
Supporting student success is a multifaceted endeavor. In keeping with previous EDUCAUSE research findings, almost a third (30%) of respondents indicated that completing a degree is the most important measure of success for their undergraduate experience.

Learn more about student success >