The Teaching and Learning Workforce in Higher Education, 2024

Want to share this report? Use our toolkit.
Following the COVID-19 pandemic, a number of workforce domains in higher education saw significant shifts in focus, reductions in staff size, and structural reorganizations. Now, several years out from the onset of the pandemic, we are taking a look at the current state of affairs, gauging whether the higher education workforce has continued to shift, shrink, or reorganize, in addition to exploring other timely and relevant workforce issues.
The data in this report are taken from a survey of teaching and learning professionals in higher ed, conducted in September through October 2023, representing 1,001 respondents from different position areas and levels at their institution.
This report is the second in a series examining specific workforce domains (cybersecurity and privacy, teaching and learning, and IT leadership) in higher education. Explore our other Workforce Reports.
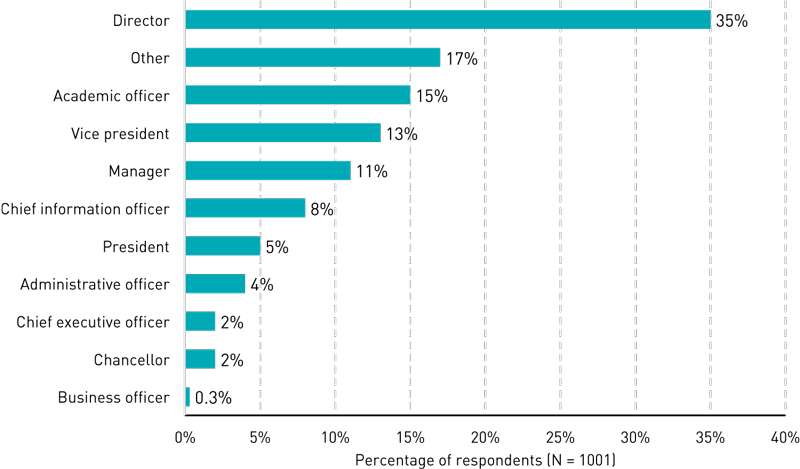
Respondent Composition
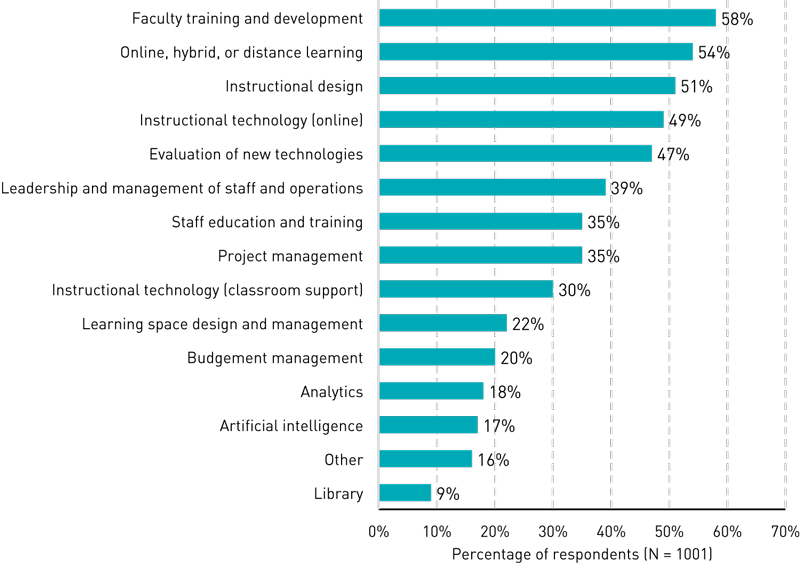
Responsibilities often fall across multiple functional areas. The three most common areas of responsibility were faculty training and development (58%), online, hybrid, or distance learning (54%), and instructional design (51%).
Read more about the respondent composition >
Structure, Size, and Reporting Lines
Respondents want simpler reporting structures, (i.e., less hierarchy) to reduce unnecessary communication and improve overall efficiency. They also expressed a desire to report to leaders who are better aligned with academics and with teaching and learning priorities.
Learn more about structure, size, and reporting lines >
Staffing and Budgets
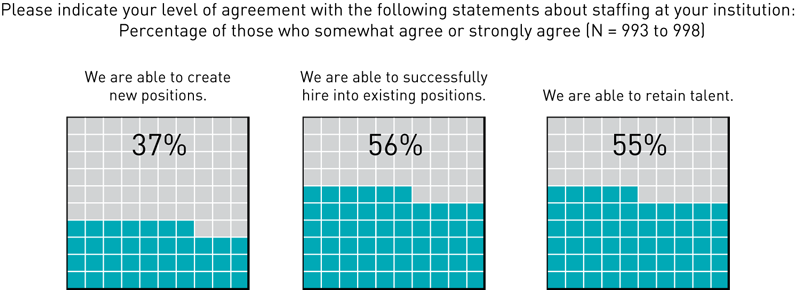
Over half of respondents agreed that their institutions are able to successfully hire into existing positions and retain talent (56% and 55%, respectively), while fewer (37%) agreed that their institution is able to create new positions.
Read more about staffing and budgets >
Flexible Work Options and Workload
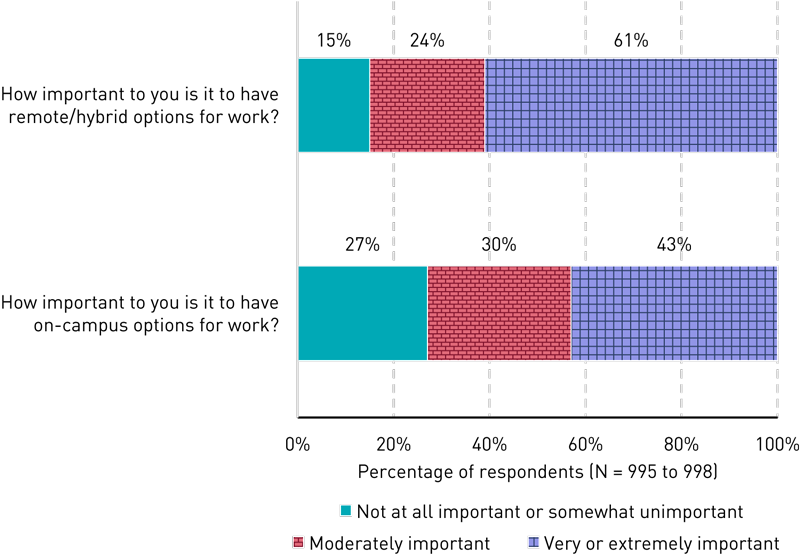
Teaching and learning professionals want hybrid options for work.
Learn more about work options and workload >
Job Satisfaction and Applying for Other Positions
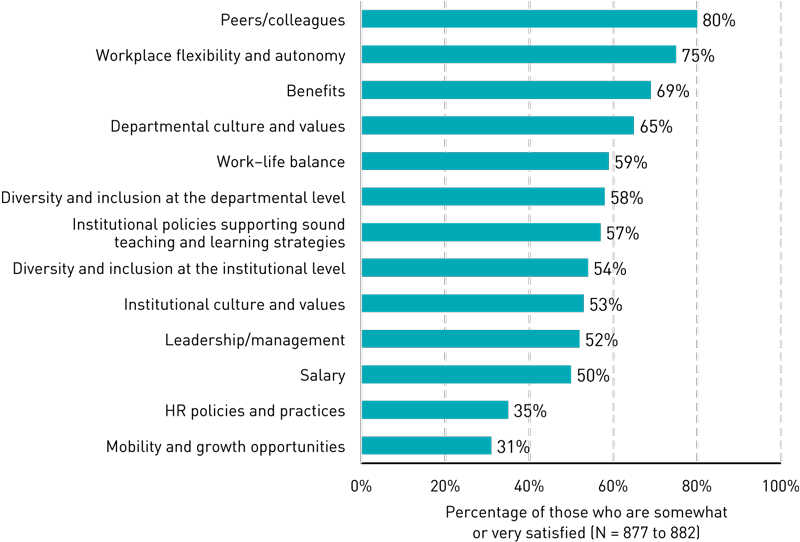
Respondents were most satisfied with their peers and colleagues.
Learn more about job satisfaction and applying for other positions >
Competencies and Professional Development
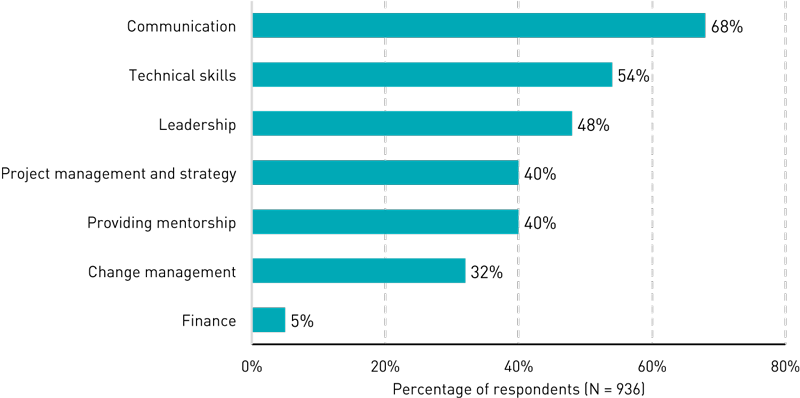
Respondents are currently most competent in communication.
Learn more about competencies and professional development >
More Workforce Resources
This report is the second in a series examining specific workforce domains (cybersecurity and privacy, teaching and learning, and IT leadership) in higher education.
Explore other technology workforce reports >
Reports and Supporting Materials