2019 Study of Faculty and Information Technology

ECAR Study of Faculty and Information Technology, 2019 presents important findings from 2019 EDUCAUSE research. It also provides technology and higher education leaders with recommendations for addressing the most pressing technology support and solution needs for faculty, with the goal of enriching faculty teaching and research experiences on campus and helping to advance student success.
Read full report: PDF | HTML | Other materials
Key Findings
Drawing on survey data from more than 9,500 faculty across 119 US institutions, this report highlights a number of important findings related to faculty technology preferences, supports, and experiences, with the goal of aiding technology and higher education professionals in improving faculty teaching and research experiences and success.
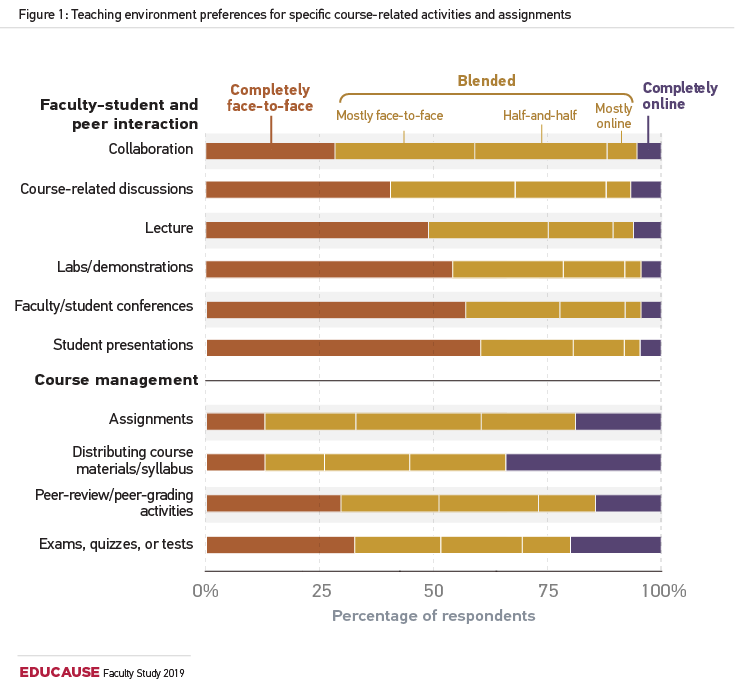
Teaching Environment Preferences
A majority (51%) of faculty prefer to teach in a blended environment that includes both face-to-face and online components. Read more about teaching environment preferences >
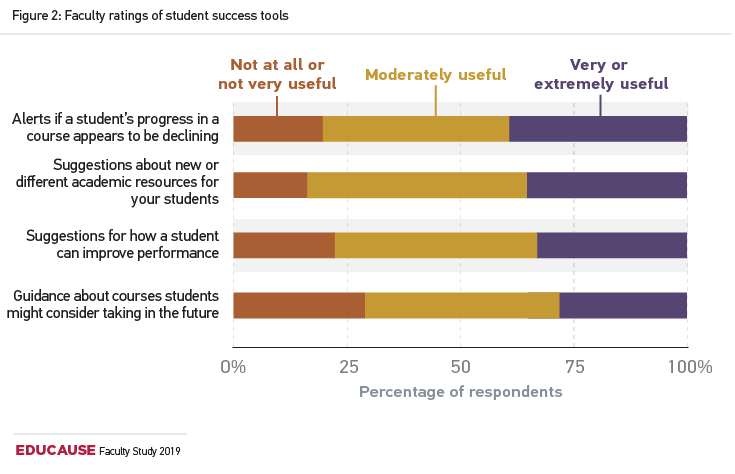
Student Success Tools
Many faculty aren't using online student success tools, but when they do use them, a majority find them at least moderately useful. Read more about student success tools >
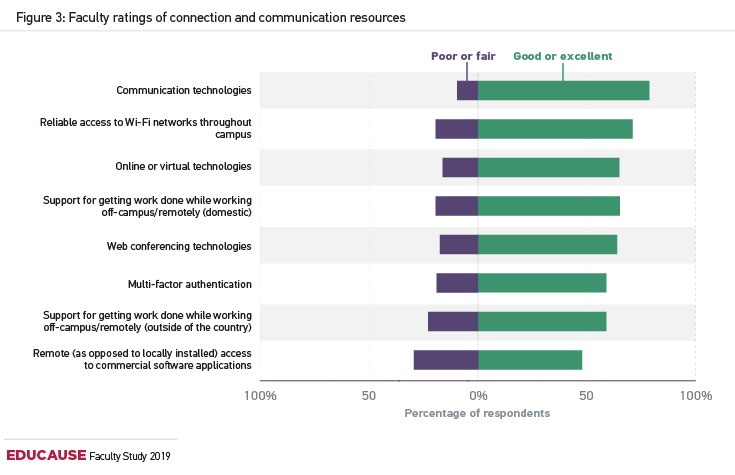
Technology Experiences
Faculty satisfaction with their overall technology experience has declined slightly. When faculty have good or excellent experiences with IT support services, their overall technology experience is good or excellent. Read more about faculty experiences with technology >
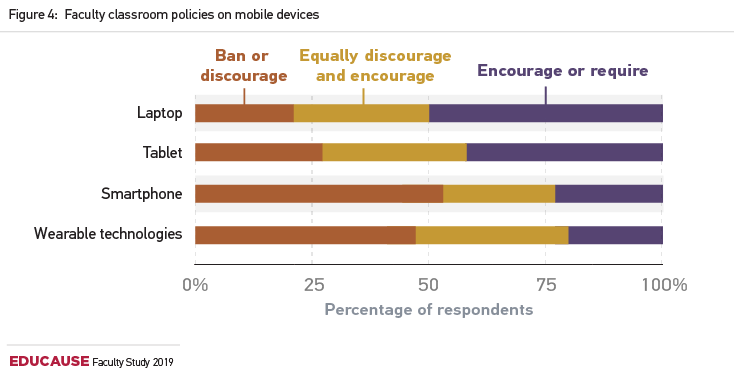
Technology Use in the Classroom
Faculty's receiving training on integrating technology in the classroom is associated with increased use of mobile technology in the classroom. Read more about technology use in the classroom >
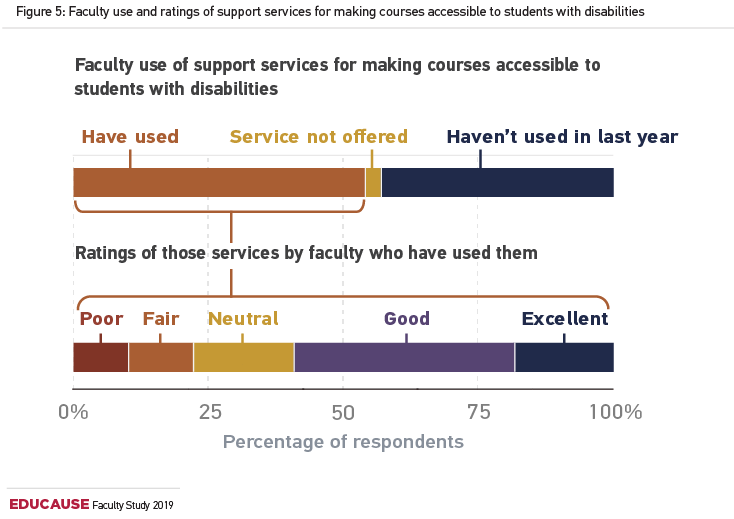
Accessibility
Faculty give high ratings to support services for accessibility technology, when they use them. Read more about accessibility >
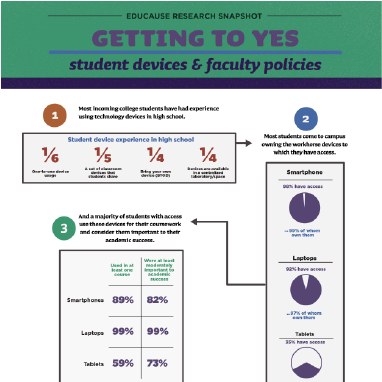
Infographic
Download the 2019 student and faculty infographic now.
Reports and Supporting Materials
Get Involved and Get Data
The faculty survey is not offered in 2020, but you can sign up now for the 2020 student survey—there's no fee and you gain access to data for your institution and peers. 2019 faculty and student survey participants can access data now in the ETRAC Portal.
Related Resources
- Accessible Technology Support for Faculty with Disabilities: Challenges and Barriers to Inclusivity
- 2019 Study of Undergraduate Students and Information Technology
- Give Me Security, Give Me Convenience, or Give Me Both!
- EDUCAUSE Student & Faculty Technology Studies, 2004-Present
- EDUCAUSE Technology Research in the Academic Community (ETRAC) website