The IT Workforce in Higher Education, 2019
This research focuses on the evolving IT workforce in higher education and builds on previous ECAR reports to provide a longitudinal perspective on important trends.
Read full report: HTML | PDF | Other materials
Key Findings
Through survey responses from more than 1,500 IT professionals in higher education, this study highlights a number of important findings (several shown below) that will be useful for technology and higher education professionals in developing the workforce and advancing their careers.
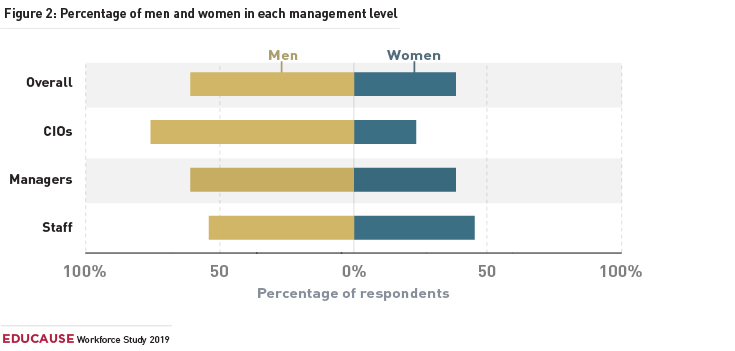
Gender
Women continue to be underrepresented in the higher education IT workforce, but their numbers have increased in recent years. Read more >
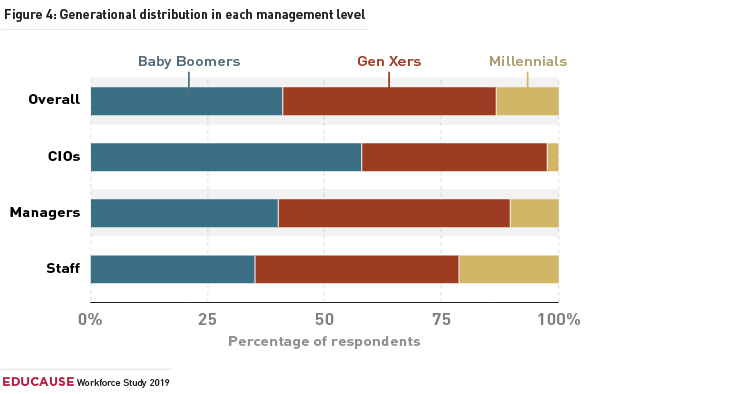
Generations
The higher education IT workforce appears to be getting older. Read more >
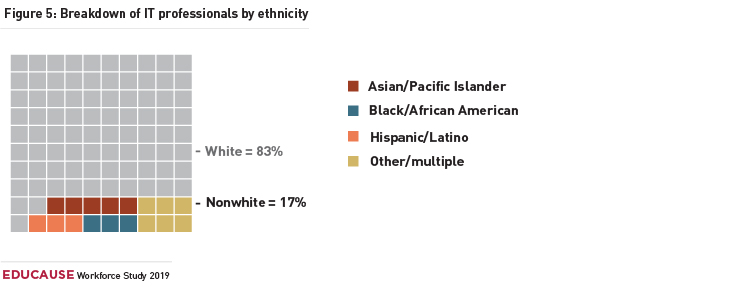
Ethnicity
The higher education IT workforce remains predominantly white. Read more >
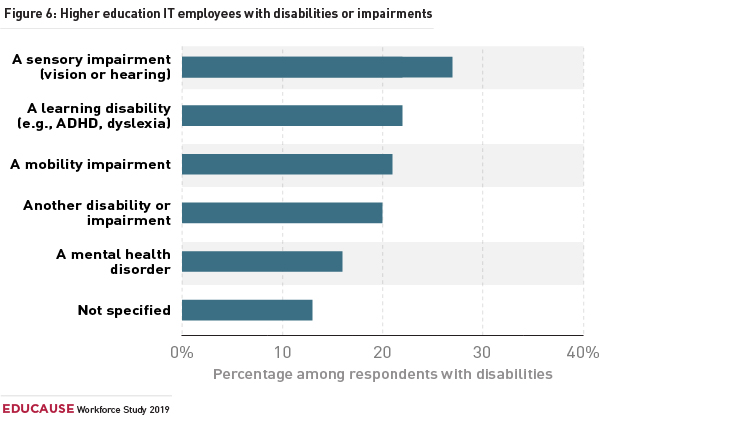
Disabilities/Impairments
The percentage of higher education IT employees who have disabilities and impairments is substantial. Read more >
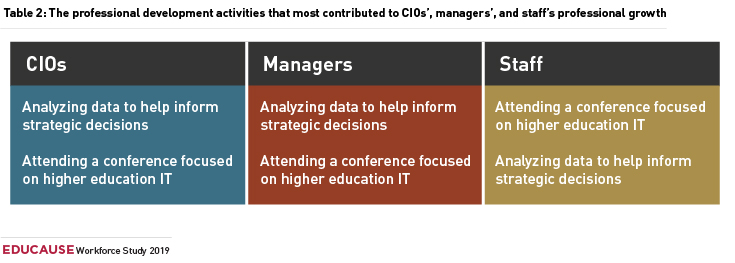
Professional Development
The professional development activities that most contributed to professional growth were analyzing data for strategic decision-making and attending a conference on higher education in IT. Read more >
Strategic Reporting Relationships
CIOs who have an appointment to a president's or a chancellor's cabinet more frequently engage in shaping their institution's academic directions and strategic activities than their counterparts who do not have those appointments. Read more >
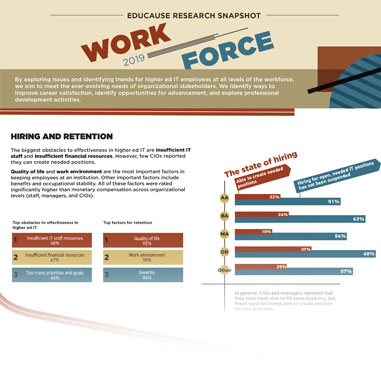
Infographic
Download the 2019 Workforce infographic now. The graphic is publicly accessible.
EDUCAUSE members: Please login to access all other Workforce materials.
Reports and Supporting Materials
Related Resources
- The IT Workforce in Higher Education: CIOs, DEI, HR, Mentoring, and Salaries
- The IT Workforce in Higher Education, 2016
- Today's Higher Education IT Workforce
- The Center for Higher Education CIO Studies Reports, 2003-2018
- Technology in Higher Education: Shaping the Future IT Workforce
- Technology in Higher Education: Guiding Aspiring Leaders
- Technology in Higher Education: Defining the Strategic Leader
- Technology in Higher Education: Information Security Leadership
- EDUCAUSE Review May/June 2016 issue: "The Future of Work"
- EDUCAUSE Review "Professional Development Commons" Blog